Application / 02 · Free-surface impact
Check a dam-break impact on a box against experiment.
Does the simulated impact load on an obstacle, and the water level that follows, match what was measured?
Availability: In development
- Inputs
- A 3.22 m long, 1 m wide tank with a 0.55 m column of water at one end and a 0.16 × 0.16 × 0.40 m box on the floor in its path. Water properties and gravity. The column is released at t = 0.
- Variables to explore
- Grid spacing (13.3, 10 and 8 mm) and the time-step limit (CFL 2 and 0.4).
- Keep the comparison consistent
- The tank, box, water column and sensor positions of the MARIN experiment (SPHERIC benchmark Test 2): four pressure sensors on the front of the box, four on its top, and four water-level gauges along the tank.
- Outputs
- Pressure histories at the eight box sensors and four water-level histories, exported as CSV, and the live fluid view.
- Comparison with measurements
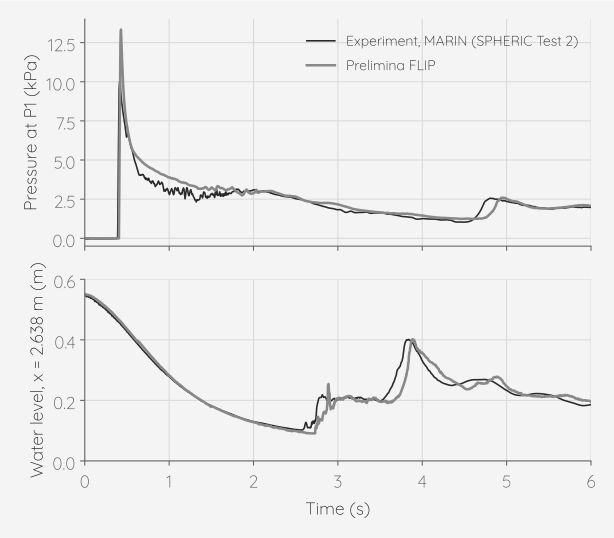
- Pressure impulse over the first second at the two lowest front sensors: +13 % (P1) and +4 % (P2) against the experiment. Mean pressure from 2 to 6 s, including the reflected waves, within 5 % on all four front sensors. The impact reaches P1 to P3 within 20 ms of the measurement. Water level near the reservoir end wall: median error 8 mm over 6 s; the returning wave arrives within 0.1 s. At the record settings the 10 and 8 mm grids give the same impulses, +13 % and +4 %; on 13.3, 10 and 8 mm grids at CFL 2 the P1 impulse stays between +8 % and +11 %.
- Physical assumptions
- A single liquid; the air is not simulated, so trapped air pockets close freely. The gate that holds the water in the experiment is not modelled: the column is released at once. Each pressure is the average over a small sphere of water in front of the sensor, not a flush wall transducer. The tank is open at the top, as in the experiment.
- Scope
- One experiment. The two upper front sensors, P3 and P4, 0.10 and 0.14 m up and close to the top edge of the box, peak 30 % and 75 % below the measurement on every grid; the cause is not yet known. The sensors on top of the box show short spikes at about 1.5 s, up to 2.7 times the measured peak, that the experiment does not. The impact peaks sit 32 % (P1) and 17 % (P2) above the measurement on both record grids, and at CFL 2 they rise as the grid is refined, so impulses are compared rather than peaks.