Application / 10 · Tanks & prescribed motion
Check sloshing in a pitching fuel tank against experiment.
Does the simulated free surface in a pitching cylindrical tank rise and fall with the measurement, period after period?
Availability: In development
- Inputs
- A horizontal cylindrical tank, 0.347 m inside diameter with a 0.89 m straight section and 2:1 elliptic heads, a quarter full of water (h/D = 0.255). It pitches ±3° about the bottom of its centre section at a 2.17 s period, 0.92 times the first sloshing frequency, starting from rest. Water properties and gravity.
- Variables to explore
- Grid spacing (5 and 4 mm), the time-step limit (CFL 2 and 0.4), density projection and PBD, and the particle-transfer settings.
- Keep the comparison consistent
- The tank, fill, motion and sensor position of the experiment by Grotle and Æsøy (2017): an ultrasonic level sensor on the roof of the straight section, looking down.
- Outputs
- Free-surface exports from which the elevation under the sensor is read, the tank motion and a bottom pressure probe as CSV, and the live fluid view.
- Comparison with measurements
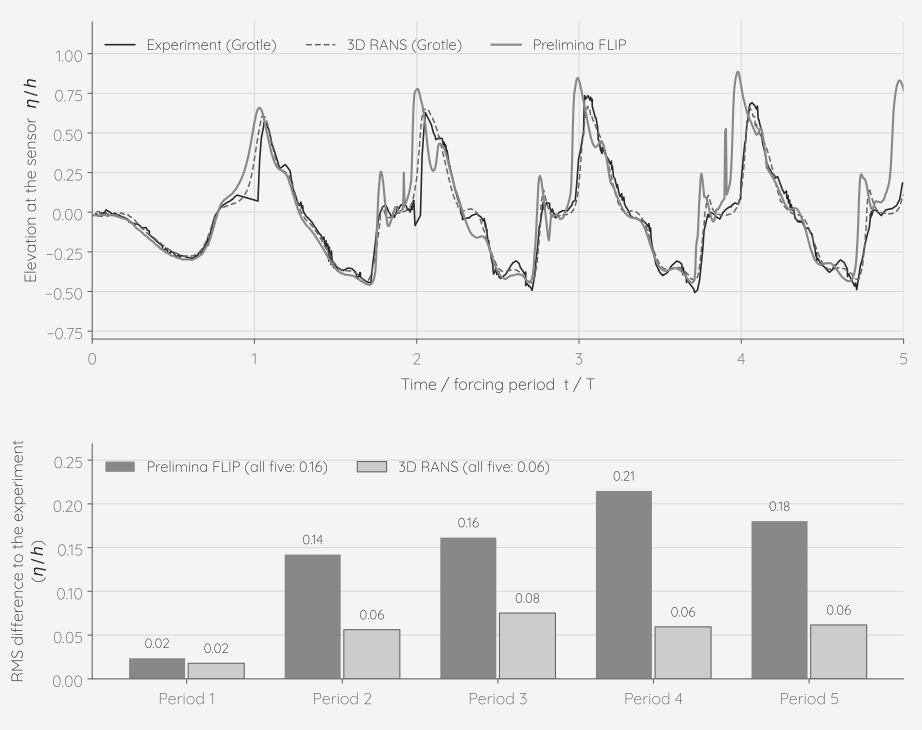
- RMS difference of η/h to the experiment over five periods: 0.16 (the published 3D RANS: 0.06). Period by period: 0.02, 0.14, 0.16, 0.21 and 0.18 (RANS: 0.02 to 0.08). The troughs are within 0.07 h of the measurement in every period. The crests of periods 1 to 4 reach 0.66 to 0.89 h against a measured 0.57 to 0.74 h, and arrive 0.03 to 0.09 periods early; delaying the simulated curve by 0.05 periods lowers the RMS difference to 0.12. A repeat run of the same set-up, read from its particles instead of the reconstructed surface, gave 0.19.
- Physical assumptions
- A single liquid; the air above it is not simulated. The tank is the inner surface only, rotating as a rigid body in a still domain, with gravity fixed. The sensor is modelled as the highest crossing of the reconstructed free surface along vertical lines within 10 mm of its axis, in the tank frame; the experiment’s ultrasonic beam is a few centimetres wide.
- Scope
- One sensor, one fill and one forcing frequency from a single experiment, and the curves are digitised from a printed figure. From the second period on, the simulated crests come early and high, so the error is about three times that of the published RANS. This run turns the affine (APIC) particle transfer off: with the current default transfer the same set-up gives an RMS difference of 0.45, because the surface reads too high from the second period on. With density projection and two PBD iterations the run completes with 0.34, from short spikes where thin sheets of water cross the sensor line.