Application / 07 · Tanks & prescribed motion
Check pressure in a sloshing tank.
Does the simulated wall pressure follow a sequence of sloshing impacts in a rolling tank, and do the impacts arrive on time?
Availability: In development
- Inputs
- A closed tank, 900 × 508 × 62 mm inside, with 93 mm of water, rolled about the centre of its floor by the measured roll history (±4°, period 1.63 s). Water properties and gravity.
- Variables to explore
- Grid spacing (6, 4 and 3 mm), the time-step limit (CFL 2 and 0.4), and the particle-transfer settings.
- Keep the comparison consistent
- The tank, fill, roll history and sensor position of SPHERIC benchmark Test 10: pressure sensor S1 on the left wall, at the still-water level.
- Outputs
- The S1 pressure history and the tank motion, exported as CSV, and the live fluid view.
- Comparison with measurements
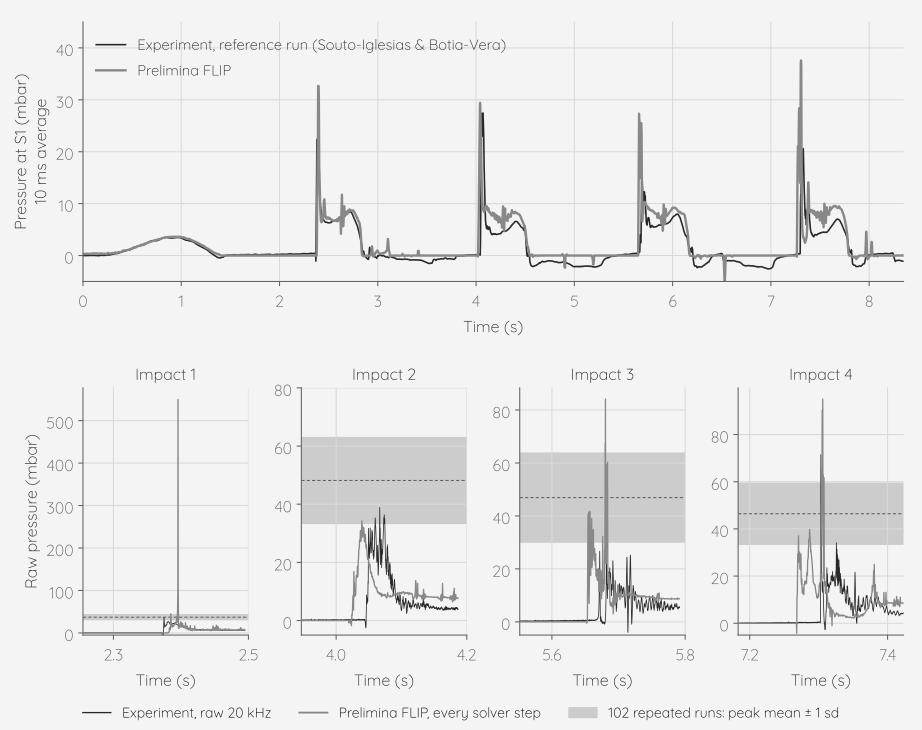
- All four impacts reach S1 within 35 ms of the measurement. Pressure impulse at S1 over each impact, from 0.4 s before to 0.3 s after the measured peak, against the reference run: −2 % for the first impact, then +35 %, +47 % and +60 %. On 6, 4 and 3 mm grids the first impulse stays between −12 % and +2 %; the later three range from +29 % to +72 %, and two identical 4 mm runs differ by up to 25 percentage points.
- Physical assumptions
- A single liquid; the air is not simulated, so the air trapped at the impacts is absent and the water closes freely. Each pressure is the average over a 6 mm sphere of water at the sensor, not a flush wall transducer. The tank rolls as a rigid body in a still domain, driven by the measured roll rate.
- Scope
- One sensor and one published experiment. The first impact gives a single-step pressure spike of up to 550 mbar against a measured 37 ± 7 mbar, and the spike grows as the grid is refined, so impulses are compared rather than peaks. From the second impact on, the pressure after each impact sits about 3 mbar above the measurement under every setting tried, so the later impulses come out 30–70 % high; the air that the experiment traps at these impacts, which is not simulated, is the leading candidate. From the second impact on, a few hundred particles hang as spray above the water.