Application / 01 · Tanks & prescribed motion
Check sloshing wall pressure against experiment.
Does the simulated pressure on the tank wall match what was measured?
Availability: In development
- Inputs
- A 0.6 m long tank with 6 cm of water, moved sideways with a 6 cm amplitude at a 1.3 s period, close to the first sloshing mode. Water properties and gravity.
- Variables to explore
- Forcing period and amplitude, fill depth, and grid spacing. The published experiment also covers 0.8 s and 1.7 s periods.
- Keep the comparison consistent
- The same tank, fill, motion, and probe position as the experiment. The motion is ramped in over the first three periods and the comparison uses periods 13 to 18.
- Outputs
- A pressure history at the wall probe, exported as CSV, and the live fluid view.
- Comparison with measurements
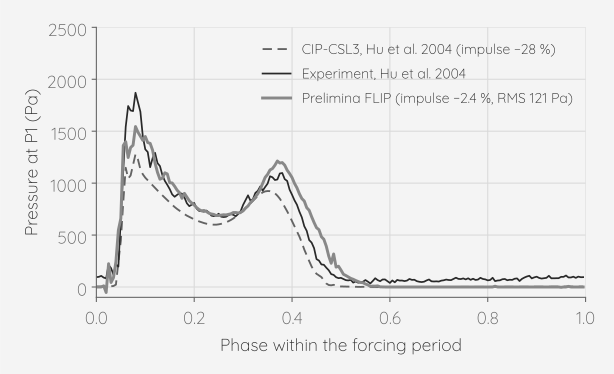
- Pressure impulse per period: −2.4 % against the experiment (the published CIP-CSL3 simulation: −28 %). RMS difference of the phase-averaged curves: 121 Pa (CIP-CSL3: 165 Pa). A repeat run of the same set-up gave −0.3 % and 130 Pa, so run-to-run spread is about 2 %. A 4, 3 and 2 mm grid study on an earlier build stayed within ±3 % in impulse.
- Physical assumptions
- The tank motion is imposed, applied as an acceleration of the tank frame. The water is a single liquid; the air above it is not simulated. The model is a 6 cm wide slice between walls, 20 cells across, so the flow is close to two-dimensional.
- Scope
- One forcing period and one probe from a single published experiment. The experiment does not state its time origin, so the curves are aligned in phase by cross-correlation before comparison; peaks above 2500 Pa are clipped, so impact maxima are not compared. Individual simulated impact peaks vary from period to period and reach well above the printed range.