Application / 11 · Tanks & prescribed motion
Check sloshing wall pressure with the air resolved.
Does the wall-pressure impulse still match the measurement when the air above the water is simulated too?
Availability: In development
- Inputs
- The tank of application 01: closed, 0.6 m long, 0.3 m high and 0.06 m wide, with 6 cm of water and air above it at a 1000:1 density ratio. It is moved sideways with a 6 cm amplitude at a 1.3 s period, ramped in over the first three periods. Water and air properties and gravity.
- Variables to explore
- Single phase or water and air, grid spacing (8, 6 and 4 mm), and repeat runs of each configuration.
- Keep the comparison consistent
- The tank, fill, motion and probe position of the experiment: pressure sensor P1 on the right-hand end wall, 5 cm above the floor. A second probe in the air at the roof centre sets the reference level for the two-phase pressure. Impulses are compared over forcing periods 4 to 6.
- Outputs
- Pressure histories at P1 and the roof probe, exported as CSV, volume fields of phase and velocity for the section view, and the live fluid view.
- Comparison with measurements
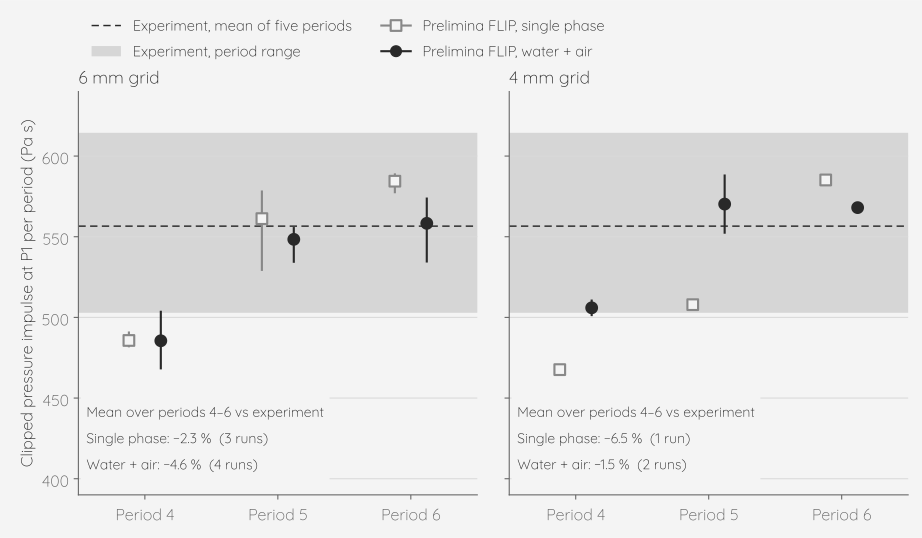
- Mean pressure impulse per period against the experiment: water and air −4.6 % on the 6 mm grid (four runs) and −1.5 % on the 4 mm grid (two runs); single phase −2.3 % (three runs) and −6.5 % (one run). Period by period the two-phase mean stays within about 10 % of single phase (at most 12 %, on the 4 mm grid, where single phase has one run), and its run-to-run scatter is similar. Resolving the air costs about 1.8 times the single-phase run time: 134 s against 75 s for 7.8 s simulated on the 4 mm grid.
- Physical assumptions
- Water and air are both simulated, the air at 1/1000 of the water density. Both are incompressible: the air has no equation of state, so it does not cushion the impacts. Prelimina FLIP in its phase-field variant (Braun, Bender and Thuerey 2025) with grid-velocity RK3 advection. The tank motion is imposed as an acceleration of the tank frame. Each pressure is the average over a small sphere at the probe, not a flush wall transducer. The model is a 6 cm wide slice between walls, so the flow is close to two-dimensional.
- Scope
- Impulses are compared, not impact peaks: the air is incompressible, so it cannot cushion an impact. The tank is closed. On the 8 mm grid the impulse comes out 24 % high; use about ten cells or more across the water depth. Repeat runs of one set-up differ from period to period, so use at least three runs per configuration where that scatter matters.